Sierra Imaging & Thermal Vision: OEM Core Selection and Integration Guide
Sierra Imaging & Thermal Vision: OEM Core Selection and Integration Guide
Thermal imaging serves as a sensing modality across industrial automation, mobile robotics, condition monitoring, predictive maintenance, and embedded edge vision. Engineers arriving from broad searches such as sierra imaging or industrial thermal vision still need to identify the actual manufacturer and module configuration. This guide focuses on generic OEM thermal-core selection and CAMCUDA integration examples; the search phrase does not establish a supplier relationship or product equivalence. Specifying an uncooled long-wave infrared (LWIR) sensor requires an end-to-end grasp of microbolometer semiconductor physics, raw digital signal transport mechanics, optical engineering principles, and any model-specific radiometric processing pipeline.
Here’s the deal: getting an uncooled thermal core into a commercial product demands a no-compromise balance across your SWaP-C budget (Size, Weight, Power, and Cost). Whether you are packing an infrared engine into a ruggedized handheld diagnostic gun, a factory-floor inspection rig, or an aerial inspection drone, you have to weigh detector resolution, thermal sensitivity, lens athermalization, bus bandwidth, and host processor loads. This architectural guide cuts through the marketing noise to give OEM systems architects, embedded hardware engineers, and technical procurement teams a practical engineering framework for evaluating, selecting, and shipping uncooled LWIR thermal imaging modules.
Table of Contents
- 👉 1. Infrared Physics & Microbolometer Fundamentals
- 👉 2. Embedded Electrical Architectures & Signal Processing Pipelines
- 👉 3. Optical Engineering: Lens Geometry & Environmental Athermalization
- 👉 4. Industrial LWIR Core Technical Matrix & Product Analysis
- 👉 5. Host Firmware, Radiometric Calibration, and Edge AI Integration
- 👉 6. OEM Procurement Framework & Integration Verification Protocol
- 👉 7. Comprehensive Technical FAQ
1. Infrared Physics & Microbolometer Fundamentals
To successfully integrate thermal imaging cores, engineers must first analyze how uncooled microbolometers detect and transduce radiative thermal flux into usable digital data streams. Visible cameras form images from visible light reaching the sensor, including reflected light and self-luminous sources. Uncooled LWIR cameras can operate without visible illumination, but their signal includes target emission, reflected surroundings and radiation along the optical path.
1.1 LWIR (8–14 µm) Transmission Dynamics & Thermal Flux
Infrared band boundaries vary by convention; 3–5 µm and 8–14 µm are commonly used MWIR and LWIR imaging windows. For a blackbody, the wavelength-domain Wien relation is λpeak ≈ 2898/T µm when T is in kelvin. From −40 °C to +100 °C, the peak moves from approximately 12.43 µm to 7.77 µm, so it is not entirely inside 8–14 µm. Objects throughout this range still emit useful energy across the LWIR band.
At about 300 K, blackbody spectral radiance peaks near 9.7 µm. The LWIR atmospheric window is useful for terrestrial imaging, but transmission varies with wavelength, path length, humidity and weather. Atmospheric absorption, fog and rain can reduce target contrast and range; 8–14 µm is not an attenuation-free channel.
Target temperature, emissivity, atmospheric transmission, optics and aperture all affect the energy reaching the focal-plane array. The expression below is only a target-emission, bolometric approximation for an extended graybody with wavelength-independent transmission and approximate on-axis lens throughput. It integrates all wavelengths, not just the detector band:
Target-only bolometric irradiance (Etarget,bol) ≈ [ τatm × τopt × ε × σ × T4 ] / [ 4 × (F/#)2 ]
Here, τatm and τopt denote atmospheric and optical transmission, ε is target emissivity, σ is the Stefan–Boltzmann constant, T is absolute temperature and F/# is lens f-number. A band-limited calculation instead integrates Planck spectral radiance over the actual passband with wavelength-dependent transmission. Temperature measurement must also account for reflected surroundings, atmospheric emission and relevant window or optics contributions through the camera’s calibrated model. Emissivity depends on material, surface finish, wavelength and viewing conditions. For practical calibration context, see our Thermal Imaging Guides.
1.2 VOx vs. a-Si Focal Plane Arrays and Pixel Pitch Evolution
Uncooled thermal cores use a Focal Plane Array (FPA) populated by thousands of microbolometer pixels. Each pixel is an infrared-absorbing membrane suspended on micro-machined isolation bridges above an underlying silicon Readout Integrated Circuit (ROIC). Incident infrared photons strike the membrane, heat it up, and shift its bulk electrical resistance. The ROIC measures the resulting resistance-dependent electrical signal; biasing and readout architecture vary by detector.
In modern production, you will encounter two primary thermoresistive materials:
- ✅ Vanadium Oxide (VOx): VOx is widely used in uncooled microbolometers. TCR and noise are material and process dependent; assess the finished detector’s NETD, response time, uniformity and temperature stability under stated test conditions.
- ⚙️ Amorphous Silicon (a-Si): a-Si is another established microbolometer material. Fabrication, pixel geometry, packaging and readout design affect performance and cost. The material name alone does not establish thermal isolation, wafer cost or a module’s NETD relative to a VOx product.
Reducing pixel pitch reduces active-array dimensions for a fixed pixel count. At the same angular sampling, focal length can decrease with pixel pitch, and a fixed f-number then implies a smaller entrance pupil. These geometric opportunities do not guarantee a lighter or cheaper finished lens: diffraction, MTF, sensitivity, mechanical packaging and production volume still constrain the design. Compare the complete lens-and-core assembly rather than inferring SWaP-C from pitch alone. For example, a 640 × 512 active array measures 7.68 × 6.144 mm at 12 µm pitch, compared with 16 × 12.8 mm at 25 µm.
1.3 NETD, Thermal Time Constants, and Responsivity Metrics
When you are evaluating vendor datasheets, focus on these three core detector specifications:
Noise Equivalent Temperature Difference (NETD): Expressed in millikelvins, NETD describes the temperature difference producing a signal comparable to noise under specified conditions. Lower NETD can improve low-contrast imaging, but compare values only with matched scene temperature, f-number, frame rate and processing. NETD is sensitivity, not absolute temperature accuracy, and does not by itself prove that a particular defect will be visible.
Thermal Time Constant (τ): For an approximately first-order pixel response, one time constant corresponds to 63.2% of the response to a step, or decay to 36.8% of an initial difference. Use the selected detector’s specified value rather than a universal 8–14 ms range. Frame rate and time constant are distinct; evaluate motion smear and latency with the intended optics, processing and platform motion.
Detector Responsivity (Rv): Responsivity measures the electrical output voltage swing per unit of incident radiant power, expressed in Volts per Watt (V/W). Evaluate responsivity together with noise, bandwidth, saturation limits and operating conditions; a larger voltage response alone does not guarantee better image contrast.
2. Embedded Electrical Architectures & Signal Processing Pipelines
Integrating an uncooled thermal core into an embedded board design requires pairing the module’s electrical bandwidth and power profile with the processing muscle of your host hardware, whether that is a low-power microcontroller or an edge computing multicore application processor.
2.1 Low-Power Bus Transport: SPI and I2C Implementation
Low-resolution cores, such as 160×120 or 80×60 formats, can suit battery-powered instruments and IoT nodes when their field of view and target detail meet the application. Where the module provides SPI video, an MCU with suitable SPI, DMA and memory resources may be sufficient; verify the actual protocol and sustained capture performance. Resolution and interface alone do not establish system power.
As an illustrative transport calculation, assume 160×120 active pixels, 16 transmitted bits per pixel and 25 frames per second. The image payload alone is:
Bandwidth = 160 pixels × 120 pixels × 16 bits/pixel × 25 frames/sec = 7,680,000 bits/sec ≈ 7.68 Mbps
The illustrative 16-bit 160 × 120 frame occupies 38,400 payload bytes; a double buffer needs 76,800 bytes before metadata and other working memory. The link must sustain more than this 7.68 Mbps payload after packet headers, blanking, telemetry, transaction gaps and host scheduling are included. Whether a 15–25 MHz SPI clock is supported or sufficient depends on the module protocol and host implementation. Use DMA and buffering where supported, and confirm whether control uses I2C, UART or another documented channel.
2.2 High-Throughput Digital Video: DVP, BT.656, LVCMOS, and MIPI
For a second illustrative case, assume 640×512 active pixels, 16 transmitted bits per pixel and 50 frames per second. This is a payload-sizing example, not a promise of radiometric data on every 640-format core:
Bandwidth = 640 × 512 × 16 bits × 50 frames/sec = 262,144,000 bits/sec ≈ 262.14 Mbps
This 262.144 Mbps payload requires a link and host capture path with additional capacity for transport overhead. Choose among the outputs actually supported by the selected module and host; parallel video, USB or a suitable high-speed serial interface may be options. No single resolution or bitrate establishes a universal interface requirement:
- ⚙️ Digital Video Port (DVP) / Parallel LVCMOS: A parallel interface may carry pixel data with clock and synchronization signals. Confirm bus width, logic voltage, pixel packing, timing and the specific host capture peripheral. LVCMOS describes electrical signaling, not a complete interoperable video protocol.
- ⚙️ ITU-R BT.656: This digital-video format carries embedded timing information. Confirm the module’s supported timing, bit depth and pixel format; a viewable video stream does not by itself provide calibrated per-pixel temperatures.
- ⚙️ MIPI CSI-2: Where available, confirm the physical interface, lane count, rate, data type and driver support at both ends. A CSI-2 connection does not guarantee that an SoC ISP accepts the thermal stream or preserves radiometric values.
- ⚙️ Analog Composite (PAL / NTSC): Some configurations provide CVBS for compatible monitors or video links. Confirm the required video standard and output hardware. Composite imagery is for viewing and is not a calibrated temperature-data interface.
To dive deeper into PCB routing, signal integrity, and carrier board design for high-throughput video cores, explore our technical deep dives on the CamCuda Engineering Blog.
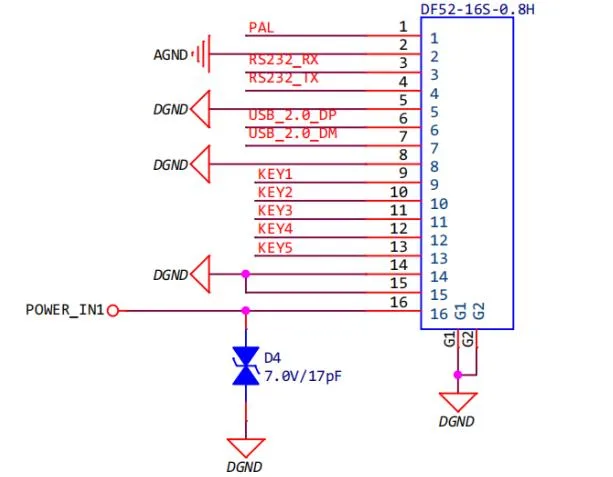
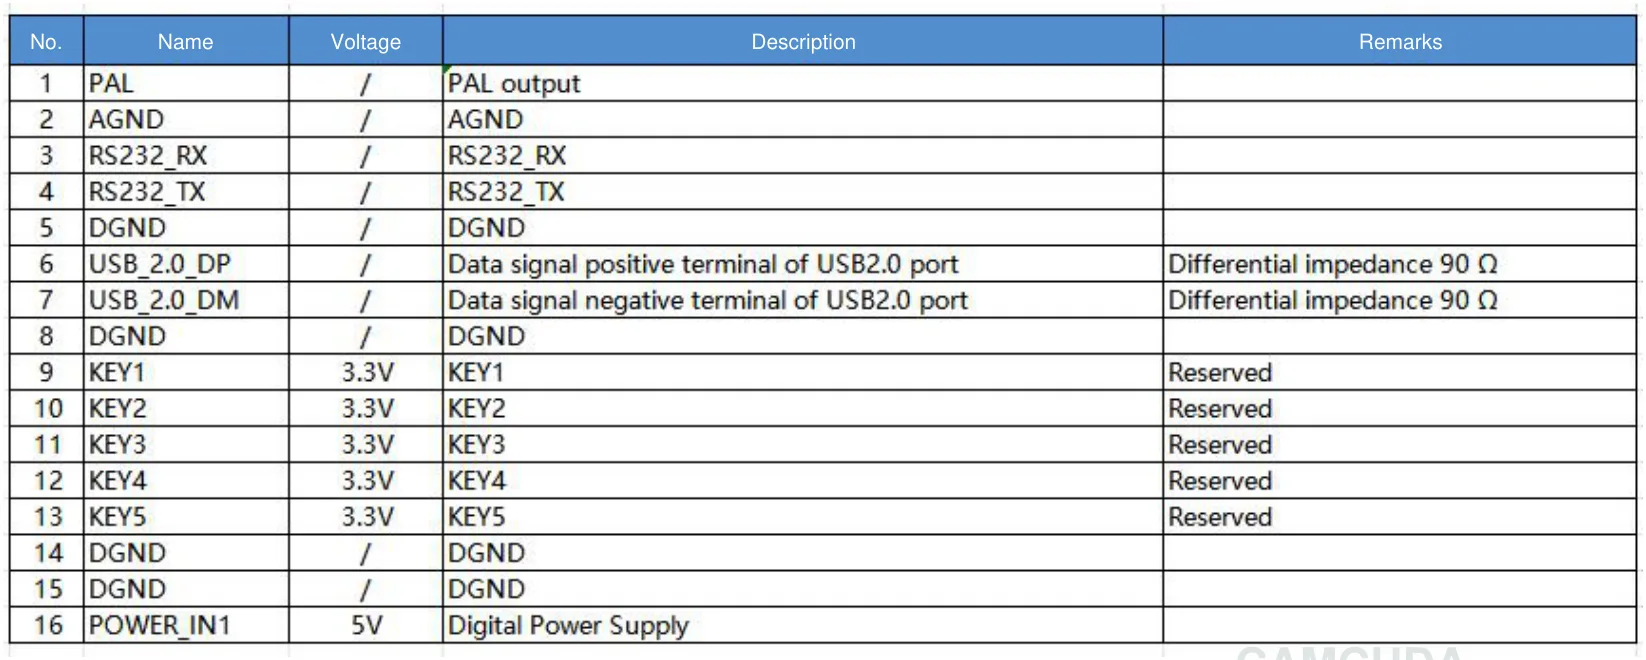
Read the diagram with the matching 16-pin signal table and AeroMini datasheet, page 3. The 16-pin path labels RS232_RX and RS232_TX; the separate 26-pin MIPI/DVP path uses 3.3 V UART TX/RX and POWER_IN2 at 5 V. Confirm the ordered board revision, signal direction and mating orientation before wiring. Neither illustrated power input accepts 12 V. The Type-C tailboard is a different configuration and requires its own guide.
SuperMini uses its own 30-pin core orientation and signal table, PDF pages 6–7, with power requirements on page 8. Its MAIN_POWER rail is 3.8–5.2 V and it also requires regulated 3.3 V and 1.8 V rails; UART logic is 1.8 V. Those definitions apply to the core without an expansion board. CVBS requires an external buffer. Do not reuse an AeroMini pinout or treat the bare SuperMini core as a USB plug-and-play module.
2.3 Power Delivery, Noise Filtering, and Multi-Rail Topologies
Thermal imaging performance can be affected by supply noise, grounding and thermal coupling from nearby electronics. Start with the exact module’s electrical specification and reference design, because a bare detector and a core with onboard regulation can expose very different power interfaces.
To preserve NETD performance and keep horizontal rolling bands or fixed-pattern noise from degrading your image, keep these power delivery rules in mind during layout:
- ⚙️ Supply Regulation: Meet the vendor’s voltage, ripple and transient limits. A switching supply, an LDO or a combination may be appropriate; select regulators using the load, ripple spectrum and thermal budget rather than a universal PSRR threshold.
- ⚙️ Filtering & Decoupling: Follow the module reference design for capacitor values, placement and grounding. Verify regulator stability and supply transients before adding ferrite beads or changing capacitance; a generic component recipe is not a substitute for the specified input network.
- ⚙️ Power-Up and Peak Load: Confirm whether the ordered core accepts one supply or requires external rails. Follow its documented sequencing, reset and I/O rules, and budget peak current for startup and shutter operation where applicable. Do not infer rail voltages or sequencing from another model.
3. Optical Engineering: Lens Geometry & Environmental Athermalization
Designing optics for thermal imaging is entirely different from building visible-spectrum camera lenses. Standard optical glasses like BK7 or fused silica act like solid walls to 8–14 µm infrared light. LWIR optical assemblies rely on specialized infrared-transmissive materials, advanced anti-reflective coatings, and passive athermalization mechanics.
3.1 Optical Materials: Germanium vs. Chalcogenide Glass
Production LWIR lenses are built around two primary optical substrates:
Monocrystalline Germanium (Ge): Germanium has a high refractive index, approximately 4 in the LWIR, and is widely used in thermal optics. Its transmission decreases at elevated temperatures and its refractive index changes with temperature. There is no universal point at 70 °C where every germanium lens becomes opaque; verify transmission, thickness, coating and the supplier’s operating-temperature limit for the selected element.
Chalcogenide Glass: Infrared chalcogenide glasses offer composition-dependent transmission and thermo-optic properties, and some grades support precision molding. A selected grade can help athermalization or manufacturing cost, but performance across temperature and any volume-cost advantage must be established for the actual optical design and production process.
AR coatings are commonly used to reduce surface reflection, while protective coatings such as DLC depend on the element and environment. With refractive index n ≈ 4, a single uncoated air–germanium interface reflects about [(n − 1)/(n + 1)]² ≈ 36% at normal incidence. This is a single-surface estimate, not the transmission of a finished lens assembly.
3.2 Passive Athermalization Over a Specified Temperature Range
Specify the required focus performance over the application’s operating range, for example −40 °C to +80 °C where the selected assembly is rated for it. When temperatures shift across an uncompensated lens, three factors occur at the same time:
- ⚙️ Refractive Index Shift: The refractive index of the lens elements drifts significantly due to the material’s dn/dT coefficient.
- ⚙️ Curvature Expansion: Lens radii of curvature and element thicknesses expand or contract mechanically.
- ⚙️ Housing Expansion: The mechanical lens barrel (typically aluminum) expands or contracts, altering the back-focal distance between the optical rear vertex and the microbolometer FPA plane.
Uncompensated thermal changes can shift focus and reduce modulation transfer function (MTF). The significance depends on the lens design, detector sampling and temperature range. Active focus can compensate within its design limits, with associated actuator, control, power and mechanical requirements.
Passive Opto-Mechanical Athermalization balances optical and mechanical temperature effects using a suitable combination of lens materials, shapes and housing expansion. It can reduce focus drift without a powered focus actuator, but residual defocus and MTF must be verified across the specified temperature range. A material pairing alone does not guarantee an athermal assembly.
3.3 Instantaneous Field of View (iFOV) & DRI Calculations
To map target detection capabilities for your integrated system, optical engineers calculate Field of View (FOV) alongside Instantaneous Field of View (iFOV). For a small on-axis angle, iFOV approximates the angular pitch sampled by one detector pixel. With pitch in µm and focal length in mm, the ratio below is already in milliradians; optical blur can make effective spatial resolution worse than this sampling interval:
iFOV (milliradians) ≈ Pixel Pitch (µm) / Focal Length (mm)
Detection, recognition and identification (DRI) describe different visual tasks. Johnson-style pixel or cycle criteria can support preliminary range estimates only with stated target dimensions, contrast, optics, atmosphere and probability assumptions. They are not universal success thresholds for every observer or AI algorithm, and a STANAG claim requires the actual standard and test method:
- ⚙️ Detection: Determine that a target is present. Establish the required detection probability and false-alarm rate for the target and background, then validate the range with the selected system.
- ⚙️ Recognition: Distinguish a defined target category, such as a person or vehicle. Required image detail depends on the categories, viewing conditions and observer or algorithm.
- ⚙️ Identification: Resolve the specific features required by the application. Define those features and verify performance; a fixed pixel count alone does not establish identity or reliable feature discrimination.
For example, 12 µm pixels and a 9 mm focal length give approximately 1.33 mrad on-axis geometric sampling, or about 0.133 m per pixel at 100 m. This is not a resolved spot size, a DRI guarantee, or a valid temperature-measurement footprint. Use the thermal imaging calculator for preliminary FOV and iFOV planning, then validate the actual lens, target and scene. If the project needs a finished observation device, include the display, enclosure, power system and acceptance tests in the RFQ.
4. Industrial LWIR Core Technical Matrix & Product Analysis
Selecting the right core comes down to aligning system requirements with the physical, electrical and optical properties of available hardware. The current comparison below uses two featured CAMCUDA imaging configurations: the SuperMini 640 bare-core integration path and the AeroMini 640 with a 9 mm lens and USB + CVBS + MIPI tailboard. Both have 640 × 512 arrays and neither selected configuration measures temperature. Their pixel pitch, optics, integration envelope and supplied hardware differ; the low-resolution examples in Section 2 remain generic design examples.
4.1 CAMCUDA SuperMini 640: 50 Hz Imaging Core
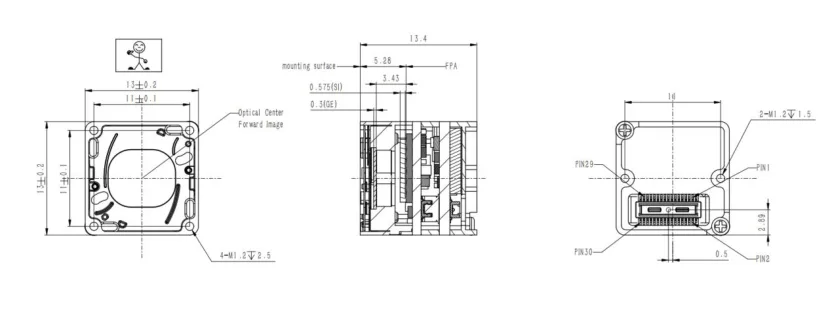
The CAMCUDA SuperMini 640 is a 640 × 512 uncooled VOx imaging core with 8 µm pixels and 50 Hz imaging output. It is an imaging-only model: the separate SuperMini 640T is a 30 Hz thermographic configuration. The bare-core reference is 13 × 13 × 13.4 mm and less than 3.5 g, excluding the lens, flange and expansion board. Typical core power is ≤0.5 W at 25 °C, excluding the expansion board; this is not a complete host-system power budget.
SuperMini specifies an 8–14 µm response and NETD ≤40 mK at 25 °C, F1.0. F1.0 athermal lens options are 3.7, 6.1, 8.7 and 11 mm; the published 6.1 mm reference is 46.6° H × 37.6° V, not a default supplied lens. The 30-pin core supports documented LVCMOS/BT.656 or 2-lane MIPI paths; BT.656 and MIPI cannot operate simultaneously. UART uses 1.8 V logic, and the multi-rail supply needs the matched integration design. Lens, interface, expansion board, cables and quantity are confirmed by quotation before an order is accepted.
SuperMini 640 Imaging-Core Engineering Specifications
| Parameter Category | CAMCUDA SuperMini 640 — Imaging / 50 Hz |
|---|---|
| Product Model & Evaluation | CAMCUDA SuperMini 640 imaging-only model; configuration review and quotation required |
| Detector Resolution | 640 × 512 pixels (327,680 pixels); uncooled VOx detector |
| Pixel Pitch & Spectral Band | 8 μm pixel pitch; 8–14 μm LWIR |
| Frame Rate & Measurement | 50 Hz imaging; no temperature measurement. SuperMini 640T is a separate 30 Hz thermographic model |
| Optical Configuration & FOV | F1.0 athermal options: 3.7 / 6.1 / 8.7 / 11 mm. Published 6.1 mm reference: 46.6° H × 37.6° V; confirm the quoted lens |
| Power Rails & Typical Power | MAIN_POWER 3.8–5.2 V plus regulated 3.3 V and 1.8 V rails; ≤0.5 W typical at 25 °C, excluding the expansion board |
| Host Video & Control | Hirose 30-pin interface; 8-bit LVCMOS / BT.656 or 2-lane MIPI; BT.656 and MIPI cannot operate simultaneously; UART uses 1.8 V logic |
| Operating Temperature | −40 °C to +70 °C for imaging operation |
| Core Envelope & Evaluation | 13 × 13 × 13.4 mm and <3.5 g, excluding lens, flange and expansion board. Confirm optics, interface, cables and matched documentation in the quotation |
Review SuperMini 640 Configuration & Request a Quote ➔
4.2 CAMCUDA AeroMini 640: Non-radiometric 9 mm Configuration
The CAMCUDA AeroMini 640 combines a 640 × 512 VOx detector, 12 µm pixels and an 8–14 µm LWIR response. This comparison selects the non-radiometric 9 mm version with the USB + CVBS + MIPI tailboard: 60 Hz is the factory default, with a 30 Hz factory option at the same price. Select the required rate before ordering and confirm format/rate support for the actual output path and host. The configuration does not measure temperature. Dimensions are 21 × 21 × 28 mm and mass is under 20 g, both excluding the lens and flange; typical module power is below 0.5 W at 25 °C.
AeroMini specification and integration sources: use the current product page for the selected configuration and NETD ≤30 mK at 25 °C, F/1.0. The 9 mm lens is specified at 48.7° H × 38.6° V, F/1.0. The AeroMini datasheet provides the illustrated 16-pin and 26-pin interface references; its older family sensitivity and 5/12 V entries do not override the current product specification or the illustrated connectors’ 5 V input limits. The selected kit includes the module, 9 mm lens, USB + CVBS + MIPI tailboard and pictured USB cable; customer soldering is required. The Type-C + CVBS board is a separate option.
| Detector | Uncooled VOx |
|---|---|
| Resolution | 640 × 512 pixels |
| Pixel pitch | 12 μm |
| Spectral response | 8–14 μm |
| Frame rate | Non-radiometric imaging: 60 Hz factory default; optional 30 Hz factory configuration at the same price. Confirm output rate for the selected interface and host |
| NETD | ≤30 mK at 25 °C, F/1.0, as specified on the current product page |
| F-number | F/1.0 |
| Polarity | White hot / Black hot |
| Supply voltage | 5 V at the illustrated POWER_IN1 / POWER_IN2 connector inputs. Do not apply 12 V to these pins; confirm the supplied board revision |
| Typical power at 25 °C | <0.5 W for the module; complete-kit and host consumption may differ |
| Digital video | Selected USB + CVBS + MIPI tailboard; USB UVC / MIPI output format and frame rate require matching to board, firmware and host |
| Analog video | CVBS path on the selected tailboard; confirm the required PAL or NTSC output mode |
| Serial communication | Illustrated 16-pin connector: RS232_RX / RS232_TX. Illustrated 26-pin connector: 3.3 V UART TX / RX. Confirm the matched control guide; no default RS422 or USB serial assumption |
| Dimensions | 21 × 21 × 28 mm, excluding lens and flange; request the complete 9 mm lens and board assembly drawing |
| Weight | <20 g, excluding lens and flange; confirm complete assembly mass |
| Temperature measurement | Not supported by this selected non-radiometric imaging configuration |
| Selected lens & FOV | 9 mm; 48.7° H × 38.6° V. Other lens options require their own assembly and FOV review |
| Operating temperature | −40 °C to +80 °C |
| Storage temperature | −50 °C to +85 °C |
| Humidity | 5–95%, non-condensing |
The separate AeroMini 25 Hz radiometric version is currently out of stock and available for an availability enquiry only. It is not available for online purchase, pre-order or deposit. The listed radiometric lens choices are 9, 13 and 18 mm; the interface and final configuration must be confirmed. These temperature-measurement capabilities do not apply to the selected non-radiometric module.
For host development, the official AeroMini resource FAQ links the documentation and USB SDK resources. Follow the vendor package instructions and match the board, firmware, operating system, format and rate to the host. These AeroMini resources are not a SuperMini SDK. The standard AeroMini configuration does not provide RAW/minimally processed video; request a customization assessment if that is required.
Review the selected AeroMini 9 mm configuration or request an OEM quote →
4.3 Direct Parameter Comparison Table
The comparative matrix below matches the two selected imaging configurations side by side. It separates core dimensions and power from the complete lens, board, cable and host assembly; confirm the delivered configuration before committing the carrier design.
| Engineering Metric | CAMCUDA SuperMini 640 — Imaging / 50 Hz | CAMCUDA AeroMini 640 — Non-radiometric / 9 mm / USB + CVBS + MIPI |
|---|---|---|
| Native Array Resolution | 640 × 512 (327,680 pixels) | 640 × 512 (327,680 pixels) |
| Pixel Pitch | 8 μm | 12 μm |
| Spectral Range | 8–14 μm LWIR | 8–14 μm LWIR |
| Thermal Sensitivity (NETD) | ≤40 mK at 25 °C, F1.0 | ≤30 mK at 25 °C, F1.0 |
| Frame Rate & Measurement | 50 Hz imaging only; no temperature measurement | 60 Hz factory default or 30 Hz factory option; no temperature measurement |
| Optical System & FOV | F1.0 athermal 3.7 / 6.1 / 8.7 / 11 mm options; 6.1 mm reference: 46.6° H × 37.6° V | Selected 9 mm F1.0; 48.7° H × 38.6° V |
| Host Video Interface | 8-bit LVCMOS / BT.656 or 2-lane MIPI; BT.656 and MIPI are not simultaneous. CVBS requires an external buffer; USB expansion board is separate | Selected USB + CVBS + MIPI tailboard; confirm output format, host and rate. Factory 60 Hz does not guarantee every output runs at 60 Hz simultaneously |
| Command Interface | UART, 1.8 V logic; TX/RX referenced to the core | Illustrated board: RS232 on the 16-pin path and 3.3 V UART on the 26-pin path; confirm the supplied control wiring |
| Typical Power & Supply | ≤0.5 W at 25 °C, excluding expansion board; MAIN_POWER 3.8–5.2 V plus regulated 3.3 V and 1.8 V rails | <0.5 W module power at 25 °C; illustrated POWER_IN1 / POWER_IN2 are 5 V inputs |
| Physical Connection & Core Envelope | Hirose DF40C-30DP-0.4V(51), 30 pins; 13 × 13 × 13.4 mm, <3.5 g, excluding lens, flange and expansion board | Illustrated 16-pin USB/CVBS and 26-pin MIPI/DVP paths; 21 × 21 × 28 mm, <20 g, excluding lens and flange |
| Operating Temperature | −40 °C to +70 °C | −40 °C to +80 °C |
| Evaluation & Procurement | Compact imaging integrations; model, lens, interface, supplied items and quantity reviewed by quotation | UAV payload, robotics and compact imaging evaluation; selected non-radiometric configuration can be ordered online or reviewed through an OEM quote |
5. Host Firmware, Radiometric Calibration, and Edge AI Integration
First establish which data the core actually exports: uncorrected detector values, corrected signal data, temperature-linear measurements or display video. NUC, bad-pixel replacement, AGC and radiometry may run onboard, on the host or in a vendor SDK. The integration plan must assign only the processing steps required by the documented output stage.
5.1 Non-Uniformity Correction (NUC) & Bad Pixel Replacement
Due to semiconductor manufacturing tolerances, every individual microbolometer pixel on the array has a slightly different responsivity (gain) and electrical baseline (offset). Left uncorrected, this creates Fixed-Pattern Noise (FPN)—a static mesh pattern overlaid on your live image.
A simple gain-and-offset NUC model can be written as below, with coefficients tied to the selected calibration convention. Practical cores may use additional temperature-dependent correction stages:
Scorrected(x, y) = Gain(x, y) × [ Sraw(x, y) – Offset(x, y) ]
Factory calibration can establish per-pixel correction coefficients, while operating temperature changes can require additional compensation. Shutter-based flat-field correction supplies a near-uniform reference; shutterless correction uses a different algorithm and does not physically present such a reference. Follow the vendor’s calibration, warm-up and FFC-status requirements.
Along with NUC, Bad Pixel Replacement (BPR) can substitute estimates for pixels flagged as unusable. The detection criteria, replacement algorithm and processing location are vendor specific. Confirm whether the exported frame already includes BPR before applying any host-side correction.
5.2 Radiometric Calibration LUTs and Thermal Scaling
Radiometric interfaces may provide temperature-linear values, calibrated signal data or a vendor-specific format. Bit depth alone does not establish temperature units or calibration. Obtain the exact output definition, calibration data and SDK workflow for the ordered model and operating mode before converting values to temperature.
The C-style pseudocode below shows an integration contract, not a runnable SDK or a universal raw-count converter. Names are placeholders to map to the selected vendor’s documentation. Raw detector counts and AGC video must never be converted with a guessed slope or by dividing the sample by emissivity:
/* Conceptual C-style pseudocode; these are not CAMCUDA SDK calls. */
contract = load_verified_contract(model, firmware, output_mode);
frame = receive_frame_with_telemetry();

if (!contract.radiometric || !frame.valid || frame.is_agc_video)
    return MEASUREMENT_UNAVAILABLE;

/* Resolve emissivity, reflected temperature, atmosphere and any
   window corrections at the stage required by the vendor.
   Do not apply a correction twice. */
if (contract.format == CALIBRATED_TEMPERATURE_LINEAR) {
    verify_gain_mode_units_and_correction_state(contract, frame);
    temperature = decode_documented_temperature_encoding(frame, contract);
} else if (contract.vendor_calibrated_conversion_supported) {
    temperature = vendor_documented_conversion(
        frame, matched_calibration, frame.telemetry, measurement_settings);
} else {
    return MEASUREMENT_UNAVAILABLE;
}

check_validity_range_and_reference_target(temperature, contract);
As a units-only example, if a matched radiometric interface explicitly defines centikelvin output, 30,000 cK equals 300.00 K or 26.85 °C. That scale cannot be applied to unspecified raw ADC counts. Neither imaging-only configuration selected in Section 4 supplies calibrated temperature measurement, and this example is not a CAMCUDA API.
5.3 Edge AI Integration for Inference Pipelines
Streaming uncooled LWIR data into edge AI platforms (like NVIDIA Jetson, NXP i.MX8M Plus, or Rockchip RK3588 NPUs) can support human/vehicle classification, perimeter alerts and thermal fault detection without visible illumination. Performance still depends on scene contrast, weather, optics and validated models.
Edge AI inference pipelines require dedicated pre-processing steps:
- ⚙️ Input Format & Tone Mapping: Match the trained model’s input shape, channel order, numeric type and normalization. The camera may export signal data or processed video, and inference may use integer or floating-point tensors. AGC or CLAHE can alter contrast and must be consistent with training; bilateral filtering is a smoothing operation, not itself a conversion from 14-bit data to 8-bit. Preserve the calibrated measurement stream separately when temperature values matter.
- ⚙️ Thermal-Specific Validation: Evaluate the model on representative thermal data from the intended sensor and processing chain. RGB pretraining can be a starting point, but useful performance requires evidence on the thermal task, including difficult backgrounds, reflections, changing weather and day/night conditions. Fine-tuning and augmentation should follow measured errors.
6. OEM Procurement Framework & Integration Verification Protocol
When drafting your formal Request for Quotation (RFQ) for thermal imaging modules, follow this verification checklist to avoid costly board revisions and supply chain delays:
OEM Specification & Procurement Checklist
- ✅ Mechanical Envelope & Enclosure Needs: Specify dimensions and mass including the selected lens, flange, carrier and protective window. Confirm FOV, focus performance across the required temperature range, and environmental sealing of the complete assembly. A bare core’s rating does not establish the enclosure’s rating.
- ✅ Host Bus Routing: Match the ordered output option to the host’s connector, voltage, protocol, data format and driver. Size sustained throughput including overhead and buffering, and confirm supply limits, peak current, startup sequence and reset behavior from the matching integration documents.
- ✅ Radiometry vs. Visual Output: Decide early if you need per-pixel absolute temperature calculation (radiometric) or qualitative visual output (image-only with on-core AGC).
- ✅ Configuration & Export Documentation: Request the supplier’s current classification and shipping documentation for the exact model, origin, destination and end use. Frame rate alone does not determine export or licensing requirements; obtain confirmation for the actual order before shipment.
- ✅ Volume Pricing & Prototype Support: Account for sample costs, carrier board kits, SDK and documentation access, and volume tiers before signing production contracts.

7. Comprehensive Technical FAQ
How does embedded thermal sensor imaging differ from operating system disk imaging?
In this guide, thermal imaging means forming an image from infrared radiation reaching a detector. An uncooled microbolometer senses absorbed energy through a resistance change, followed by readout and processing whose location depends on the core. Operating-system disk imaging instead copies storage contents for deployment or recovery. For thermal integration, verify the supported image or measurement output, interface and calibration workflow.
What host interface should be chosen for embedded thermal modules?
Choose from the interfaces supported by the exact module configuration and host. As payload examples, 160×120×16 bits×25 Hz is 7.68 Mbps; 640×512×16 bits is 131.072 Mbps at 25 Hz or 262.144 Mbps at 50 Hz, before overhead. Actual transport depends on pixel packing, video encoding and telemetry. Verify sustained capture, voltage, timing, connectors and driver support. SPI may suit a documented low-resolution implementation, but its clock and total system power must be checked independently.
SuperMini 640 uses the documented 30-pin bare-core path with 1.8 V UART and multiple supply rails; an optional USB expansion board is a separately reviewed configuration. The AeroMini example selects the USB + CVBS + MIPI tailboard, with separate 16-pin and 26-pin references. Match the actual output mode and host; their wiring is not interchangeable.
How do optical selection and athermal lenses affect thermal imaging accuracy?
Infrared lens materials and housings change with temperature, which can shift focus and reduce resolved detail. Athermal optical and mechanical design can limit this drift over a specified range; confirm measured focus or MTF for the complete assembly. Temperature measurement also depends on the selected optics/window transmission and calibration, so sharp focus alone does not establish radiometric accuracy.
What is the operational difference between radiometric and image-only (non-radiometric) thermal cores?
Image-only cores provide imagery for viewing or analysis and may expose several processed or signal formats, but their output should not be assumed to represent calibrated temperature. A radiometric configuration supplies a documented route to temperature values within stated accuracy and operating limits. Confirm the output encoding, calibration and correction settings for emissivity, reflected surroundings, atmosphere and any external window. Display AGC values are not interchangeable with temperature data. Both SuperMini 640 and the selected AeroMini 9 mm configuration here are imaging-only. AeroMini’s separate 25 Hz radiometric version is currently out of stock and enquiry-only, with its interface to be confirmed; SuperMini 640T is a distinct 30 Hz thermographic model.
📚 References & Further Reading
- Measurement Physics: FLIR — The Thermographic Measurement Formula
- Interface Standard: MIPI Alliance — CSI-2 Interface Overview
- Related Guide: CamCuda Thermal Imaging Technical Guides
- System Architecture: CamCuda Engineering Blog & Embedded Vision Resources
- Current Module References: AeroMini 640 configuration and interfaces; SuperMini 640 configuration review; SuperMini Product Manual V1.0.0
- Blackbody Spectrum: NIST Wien displacement constant
- Spectral and Total Radiation: NIST optical radiation measurements and blackbody radiation
- Detector Materials: LYNRED thermoresistive-material research
- Thermal Sensitivity: FLIR comparison of thermal sensitivity
- Detector Response: LYNRED example of a product-specific thermal time constant
- Infrared Optics: Edmund Optics germanium material reference
- Infrared Glass: SCHOTT grade-specific material datasheets
- Electrical Integration: FLIR model-specific electrical integration example
- Range Planning: FLIR discussion of resolution, optics and DRI
- Detector Correction: FLIR explanation of NUC tables
- Radiometric Formats: FLIR manufacturer-specific radiometric output example
- Thermal AI: FLIR thermal training-data resource
- Integration boundary: Third-party sources explain general engineering concepts or their own products; they do not establish CAMCUDA compatibility, calibration, or completed field tests.
Technical author: Daniel · Hardware Support
Sales contributors: Vivian, Lena and Sophie.