Thermal Master P3 vs OEM Thermal Modules: Specs, Ghosting Fixes & Integration Guide
Thermal Master P3 vs OEM Thermal Modules: Specs, Ghosting Fixes & Integration Guide
Engineering teams developing automated inspection rigs, unmanned aerial vehicle (UAV) thermal payloads, and continuous process-monitoring enclosures often start prototyping with smartphone thermal cameras such as the thermal master p3. A mobile camera can quickly establish whether thermal contrast is useful for an inspection. Moving that proof-of-concept into a product requires checking the complete capture, power, mechanical, calibration and software workflow against the intended operating conditions.
Dedicated Long-Wave Infrared (LWIR) OEM thermal cores offer different integration options, but an OEM label alone does not guarantee radiometry, deterministic delivery, open software or unattended operation. This guide compares the current Thermal Master P3 PCB Master with two current CAMCUDA engineering paths: AeroMini 640 and SuperMini 640 / 640T. It also explains how to investigate ghosting-like artifacts and plan a measured migration from a mobile prototype to an embedded system.
Table of Contents
- 👉 1. Thermal Master P3 Architectural Breakdown & Limitations
- 👉 2. Ghosting Artifacts, Thermal Drift & Radiometric Shutter Calibration
- 👉 3. Consumer Dongles vs. OEM Thermal Modules: Engineering Trade-offs
- 👉 4. OEM Integration Options: CAMCUDA AeroMini 640 & SuperMini 640 / 640T
- 👉 5. Embedded Hardware & Software Integration Guide
- 👉 6. Migration Strategy: Moving from Mobile Prototypes to OEM Production
- 👉 7. Industrial Engineering FAQ
1. Thermal Master P3 Architectural Breakdown & Limitations
1.1 Mobile Host Architecture & Version-Specific Specifications
The current Thermal Master P3 PCB Master product page specifies a native 256 × 192 VOx detector with 12 µm pixels, a 25 Hz frame rate, manual focusing with macro capability, and a 40° × 30.2° field of view. Its advertised 512 × 384 output is enhanced resolution; it does not change the native detector array. The current page lists NETD <35 mK at 25°C. Match the delivered P3 version to its documentation rather than mixing figures from older manuals or other Thermal Master products.
The mobile camera, companion application and selected host form a complete system. The current listing supports Android, iOS and PC use; confirm the exact phone, connector or adapter, OS and app with the manufacturer compatibility checker. The manufacturer-linked P-series manual documents an ASIC but does not fully specify the division of processing between camera and host. Published camera frame rate is not a measured end-to-end latency result: test capture timestamps, display delay, recording and reconnect behavior on the intended host. Source: current P3 PCB Master specifications.
1.2 Power Budgets, Thermal Conditions and Retention
The P3 product page lists 0.32 W camera consumption. This is not the power draw of the phone or PC, display and recording system. Likewise, an OEM core’s typical power figure does not include every lens accessory, interface board or host. Compare complete systems at the required capture mode and duty cycle.
- ⚙️ Thermal conditions: Record ambient temperature, warm-up behavior and the effect of the final enclosure or nearby electronics. Check measurement stability against a suitable reference when temperature accuracy matters.
- ⚙️ Power and host behavior: Test supply margins, battery runtime, sleep settings, recording duration and recovery after a controlled interruption. These are acceptance checks, not evidence of a P3-specific defect.
- ⚙️ Mechanical retention: Check cable strain relief, connector access and vibration requirements for the actual assembly. Request documented operating limits and lifecycle terms before specifying continuous service.
2. Ghosting Artifacts, Thermal Drift & Radiometric Shutter Calibration
2.1 Distinguish a Persistent Pattern from Motion and Display Effects
Finite detector thermal response and temporal image filtering can affect the appearance of a moving scene. Temperature-dependent non-uniformity is a different mechanism, while display delay and clipping can create other visible symptoms. These distinctions help define a test; they do not diagnose a particular P3 image. For a manufacturer example of detector response versus pipeline latency, see the FLIR Boson engineering data sheet, section 5.10; its model-specific values are not transferred to P3 or CAMCUDA.
A faint trail or residual outline in a thermal image needs a repeatable test before it can be assigned a cause. Check focus, scene motion, display or recording delay, image-processing settings, and whether the pattern remains when the camera views a uniform scene. Record the camera version, firmware or app version, ambient conditions and the original capture for support review. Avoid exposing the detector to the sun or other intense radiation sources.
Non-uniformity correction (NUC) compensates differences in detector response. Thermal Master’s official FAQ explains that its cameras automatically perform shutter calibration and that calibration can also be triggered manually in the app when the image is abnormal. The current sources do not establish a universal interruption time, artifact mechanism or guaranteed one-step ghosting fix. Source: Thermal Master calibration FAQ.
2.2 NUC Calibration Model and Practical Checks
Factory NUC characterizes pixel-response differences using calibration measurements. A shutter presents a uniform reference that can update offset correction; this is distinct from recalculating the full factory gain calibration. A simplified gain-and-offset model is:
S_corrected(i, j) = G(i, j) × S_raw(i, j) − O(i, j)
Here, G is the pixel gain coefficient and O is the subtracted offset term. This illustrates correction of a sensor signal, not conversion directly to an absolute temperature. Actual coefficients and correction logic depend on the camera; a shutter reference is not a zero-radiance field. See FLIR’s explanation of factory NUC tables for a manufacturer example, not a specification of P3 or CAMCUDA firmware.
- Establish repeatable conditions: Secure the camera, focus on an appropriate inspection target and let the system reach a stable operating condition. Keep the scene, palette, range and any image-enhancement settings consistent between captures.
- Compare before and after calibration: Follow the model’s instructions for a manual shutter update and compare the saved images. Note any capture interruption and whether the pattern clears; do not assume that every visible trail is fixed-pattern noise.
- Verify the required output: For temperature work, compare available measurement data as well as the display. The manufacturer-linked manual also advises checking interface contact and interference, reconnecting, trying another supported phone, and contacting service if the issue persists. Provide the original files and configuration rather than inferring sensor damage or an unsupported physical cause.
For an OEM design, ask which automatic and manual NUC controls are supported by the selected firmware and how calibration affects the host stream. Shutterless correction can use scene statistics, temperature models or other references; it is not synonymous with Scene-Based Non-Uniformity Correction (SBNUC). Neither approach guarantees that all artifacts disappear. Validate documented correction modes in static and changing scenes, including any interruptions. The FLIR shuttered/shutterless explanation provides implementation examples, not a universal feature list for OEM cores.
3. Consumer Dongles vs. OEM Thermal Modules: Engineering Trade-offs
3.1 Imaging Pixels, Temperature Data and Software Access
Distinguish native detector samples, corrected or temperature-stable counts, calibrated temperature-linear output, and display-mapped video. These represent different stages of the data path. A palette image is useful for viewing thermal contrast, while quantitative analysis needs the documented format, scale, gain mode, calibration conditions and host conversion. Bit depth and interface alone do not identify physical units: a 14-bit or 16-bit value is not automatically a temperature in Kelvin. A camera can provide both display images and a separate measurement stream. See the FLIR radiometry integration guide for model-specific examples of temperature-linear and flux-linear output; confirm the actual data semantics for P3 or the selected CAMCUDA variant.
The current P3 listing advertises point, line and area measurement, alarms, isotherms and reports. Do not assume that a mobile camera provides only color video or that every OEM core provides temperature measurements. AeroMini’s 60/30 Hz version and SuperMini 640 are imaging-only. AeroMini’s 25 Hz radiometric configuration is enquiry-only, while SuperMini 640T is the thermographic model. Confirm exported data, licensing, host examples and firmware compatibility for the exact configuration before building thresholding or logging software.
3.2 Select the Host Interface and Measure the Complete Pipeline
USB, parallel video and MIPI have different receiver, cable and software requirements. Interface names alone do not establish latency, reliable recording or synchronization. Specify the required format, rate, timestamps and calibration behavior, then measure the complete acquisition pipeline on the intended host.
- ✅ SPI: Confirm supported frame and control modes, clock rate, logic levels and throughput in the selected camera’s interface document. An SPI connection alone does not establish register access, temperature data or compatibility with a particular microcontroller.
- ✅ BT.656 / BT.1120: Verify video encoding, timing and any manufacturer-specific data packing against the receiver. These are video-interface standards, not proof that the stream represents temperatures. See the ITU-R BT.656 and BT.1120 references.
- ✅ SDI & CameraLink: Select a compatible receiver and validate the installed cable and link budget. A connector or standard name does not guarantee interference immunity, a particular cable distance or end-to-end timing.
USB is also used by OEM cameras. The FLIR OEM video-interface guide illustrates why the camera format, driver and host receiver must be matched; its model-specific interface details are not P3 or CAMCUDA specifications. For the products below, AeroMini offers distinct Type-C + CVBS and USB + CVBS + MIPI kit choices. SuperMini exposes model-specific paths on its 30-pin core interface; BT656 and MIPI cannot operate simultaneously, and 640T uses the documented CDS3 or MIPI temperature-data path. SPI, BT.1120, SDI and CameraLink are not established native capabilities of these featured configurations.
3.3 Optical Engineering and Resolution–Power Trade-offs
The P3’s manually focused macro-capable optics support close inspection. For OEM integration, select the lens and field of view for the actual object size, working distance, focus range and enclosure. Confirm the ordered optical assembly’s dimensions and calibration rather than assuming every core accepts interchangeable lenses.
Resolution remains a system trade-off. A native 1280 × 1024 array has four times the detector pixels of 640 × 512; at the same field of view it samples the scene more finely, with greater data-volume demands when rate and data format are equal. A lower-resolution design can reduce data volume and may offer a different power budget, but that must be checked for the actual product and mode. Both AeroMini and SuperMini discussed here are native 640 × 512: neither is presented as a native 1280 core, a 76–78 mW substitute or a direct SPI replacement for a low-resolution module.
4. OEM Integration Options: CAMCUDA AeroMini 640 & SuperMini 640 / 640T
To bridge the gap between initial prototyping and scalable system deployment, engineers select specialized OEM cores matching their performance, Size, Weight, and Power (SWaP), and budget profiles.
4.1 CAMCUDA AeroMini 640: Board-Based Evaluation and Integration
CAMCUDA AeroMini 640 is a 640 × 512 OEM path with selectable optics and interface kits. The imaging-only version ships at 60 Hz by default, with a 30 Hz factory option. Temperature measurement requires the separate 25 Hz radiometric configuration, currently offered by enquiry. Decide which data the project needs before selecting frame rate or interface.
| Parameter | CAMCUDA AeroMini 640 specification and boundary |
|---|---|
| Detector and native array | Uncooled VOx LWIR; 640 × 512 |
| Pixel pitch / spectral range | 12 µm / 8–14 µm |
| Imaging frame rate | Non-radiometric: 60 Hz factory default or 30 Hz factory option |
| Temperature-measurement version | 25 Hz radiometric version; availability enquiry only |
| NETD | ≤30 mK at 25°C, F/1.0 |
| Optics | Select the lens for the required FOV; radiometric lens options documented as 9 / 13 / 18 mm |
| Interface kits | Type-C + CVBS; or USB + CVBS + MIPI; confirm the ordered board and supported output mode |
| Power input | Illustrated 16-pin POWER_IN1 and 26-pin POWER_IN2: 5 V only; do not apply 12 V to these pins |
| Typical module power | <0.5 W at 25°C; complete-kit and host consumption may differ |
| Dimensions / weight | 21 × 21 × 28 mm / <20 g, excluding lens and flange; confirm complete assembly |
| Developer resources | Request the board- and firmware-matched manual, serial commands, host examples and SDK resources |
The Type-C + CVBS kit includes a wiring cable and a USB-C data cable. The USB + CVBS + MIPI kit includes the pictured USB cable and requires customer soldering. These are different assemblies; their connector guides cannot be substituted for one another. Use the current AeroMini datasheet and SDK and Linux-resource FAQ to request a matched evaluation package. The available resources are not a claim of universal host compatibility or open-source software.
Review AeroMini Configuration Options ➔
4.2 CAMCUDA SuperMini 640 / 640T: A Smaller Bare-Core Path
CAMCUDA SuperMini 640 / 640T addresses space-constrained integration with an 8 µm detector pitch. The 50 Hz SuperMini 640 provides imaging without temperature measurement; the 30 Hz SuperMini 640T adds thermography. The small published envelope describes the bare core, so allow additional space and power for the lens, boards, connector, cable and host.
| Parameter | CAMCUDA SuperMini 640 / 640T specification and boundary |
|---|---|
| Detector and native array | Uncooled VOx LWIR; 640 × 512 |
| Pixel pitch / spectral range | 8 µm / 8–14 µm |
| Model and frame rate | SuperMini 640: imaging-only, 50 Hz; SuperMini 640T: thermography, 30 Hz |
| NETD | ≤40 mK at 25°C, F1.0 |
| Core dimensions / weight | 13 × 13 × 13.4 mm / <3.5 g; excludes optics and expansion boards |
| Typical core power | ≤0.5 W at 25°C, excluding expansion board; not a complete-system budget |
| Bare-core power rails | MAIN_POWER 3.8–5.2 V, typically 5 V, plus required 3.3 V and 1.8 V rails; follow manual tolerances and sequencing |
| Control / connector | 1.8 V UART logic; Hirose DF40C-30DP-0.4V(51) 30-pin core connector |
| Video and measurement path | 640: imaging; 640T: CDS3 or documented MIPI temperature-data path; BT656 and MIPI are not simultaneous |
| Optics and optional boards | Lens and expansion-board configuration confirmed by quotation; optional 4-pin USB board is separate from the bare-core interface |
SuperMini is not a ready-to-use phone dongle. Its bare-core connector requires a matched receiver and power design; USB connection options require the appropriate wiring or expansion board and confirmed host support. The English Product Manual V1.0.0 defines the 30-pin interface, power requirements and model-specific data handling. Do not apply AeroMini’s SDK or pinout to this core.
Review SuperMini Models and Request a Quote ➔
4.3 Comprehensive Specs Comparison Table
Read the power, weight and dimensions with their inclusion boundaries. NETD values are published under the stated conditions and are not a matched-system accuracy test. The P3 figures below refer to the current PCB Master product page; confirm the delivered version.
| Specification / parameter | Thermal Master P3 PCB Master | CAMCUDA AeroMini 640 | CAMCUDA SuperMini 640 / 640T |
|---|---|---|---|
| Evaluation role | Mobile or PC-assisted inspection with the matching app/software | OEM module with selectable interface kits | Bare-core OEM integration; optional expansion boards |
| Detector | Uncooled VOx | Uncooled VOx | Uncooled VOx |
| Native resolution | 256 × 192; advertised 512 × 384 is enhanced output | 640 × 512 | 640 × 512 |
| Pixel pitch | 12 µm | 12 µm | 8 µm |
| Spectral band | LWIR; P-series manual describes 8–14 µm; confirm ordered revision | 8–14 µm | 8–14 µm |
| Frame rate | 25 Hz published camera rate | Imaging: 60 Hz default / 30 Hz factory; radiometric: 25 Hz enquiry | 640 imaging: 50 Hz; 640T thermography: 30 Hz |
| NETD and stated conditions | Current page: <35 mK at 25°C | ≤30 mK at 25°C, F/1.0 | ≤40 mK at 25°C, F1.0 |
| Host connection | Confirm Android, iOS or PC version and connector compatibility | Type-C + CVBS or USB + CVBS + MIPI kit; board/firmware-specific | 30-pin core; selected video path or compatible expansion board |
| Control access | Matching app/software; verify required automation access | Request matched serial commands and SDK resources; electrical levels depend on board | UART at 1.8 V logic; follow core-referenced TX/RX definitions |
| Power supply | Host-powered; confirm the selected version and cable | Illustrated POWER_IN1 / POWER_IN2 pins: 5 V, not 12 V | MAIN_POWER 3.8–5.2 V plus required 3.3 V and 1.8 V rails |
| Published power basis | 0.32 W camera; host excluded | Typical <0.5 W at 25°C, module only | Typical ≤0.5 W at 25°C, expansion board excluded |
| Optics | Manual/macro focus; FOV 40° × 30.2° | Lens and FOV selected for the ordered configuration | Lens assembly confirmed by quotation |
| Weight basis | Confirm the complete ordered camera/version | <20 g, excluding lens and flange | <3.5 g bare core, excluding optics and boards |
| Mechanical envelope | Confirm camera, connector and host clearance | 21 × 21 × 28 mm, excluding lens and flange | 13 × 13 × 13.4 mm bare core, excluding optics and boards |
| Temperature data | Measurement functions in matching software; confirm required export/logging format | Only radiometric version; data format and accuracy require confirmation | 640T only; documented CDS3/MIPI data need model-specific host parsing |
5. Embedded Hardware & Software Integration Guide
5.1 Power Conditioning and Configuration-Specific Limits
Start with the supply requirements for the exact board or bare core. Measure rail noise, startup demand and thermal behavior with the intended host and enclosure. Choose filtering, regulation, protection and grounding from that design review; a generic capacitor recipe or regulator choice is not a substitute for the manufacturer’s limits.
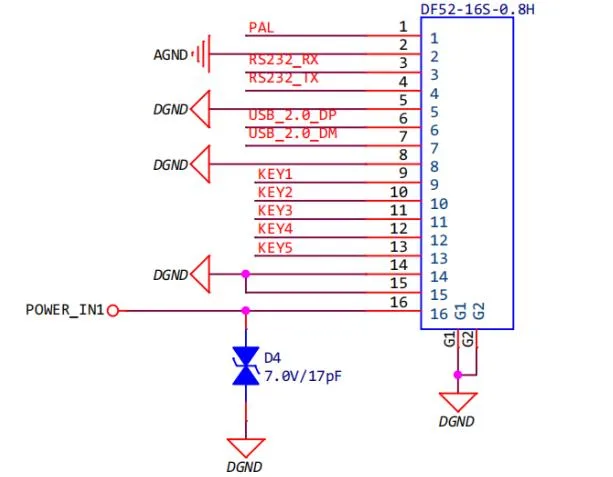
- ⚙️ AeroMini: The family specification mentions board-dependent supply options, but the illustrated 16-pin POWER_IN1 and 26-pin POWER_IN2 inputs are marked 5 V. Do not connect either to 12 V. Obtain the separate guide for a Type-C board and confirm its approved input.
- ⚙️ SuperMini bare core: MAIN_POWER is 3.8–5.2 V, typically 5 V. The 3.3 V and 1.8 V rails are also required, with manual-defined tolerances, noise limits, current demands and power-on sequence. One 5 V wire is not a complete bare-core power design.
- ⚙️ Complete assembly: Add the expansion board and host to the power budget. Disconnect power before mating cables and use ESD precautions. Do not apply an optional board’s input range to the bare core.
5.2 Connector, Control and Host-Software Validation
For AeroMini, pair the selected board with its own diagram and signal table. The 16-pin USB/CVBS and 26-pin MIPI/DVP references describe the illustrated board, not every kit. Confirm UART electrical levels and whether the supplied board implements any requested RS-232 or RS-422 path. Do not assume that a serial protocol name establishes voltage levels.
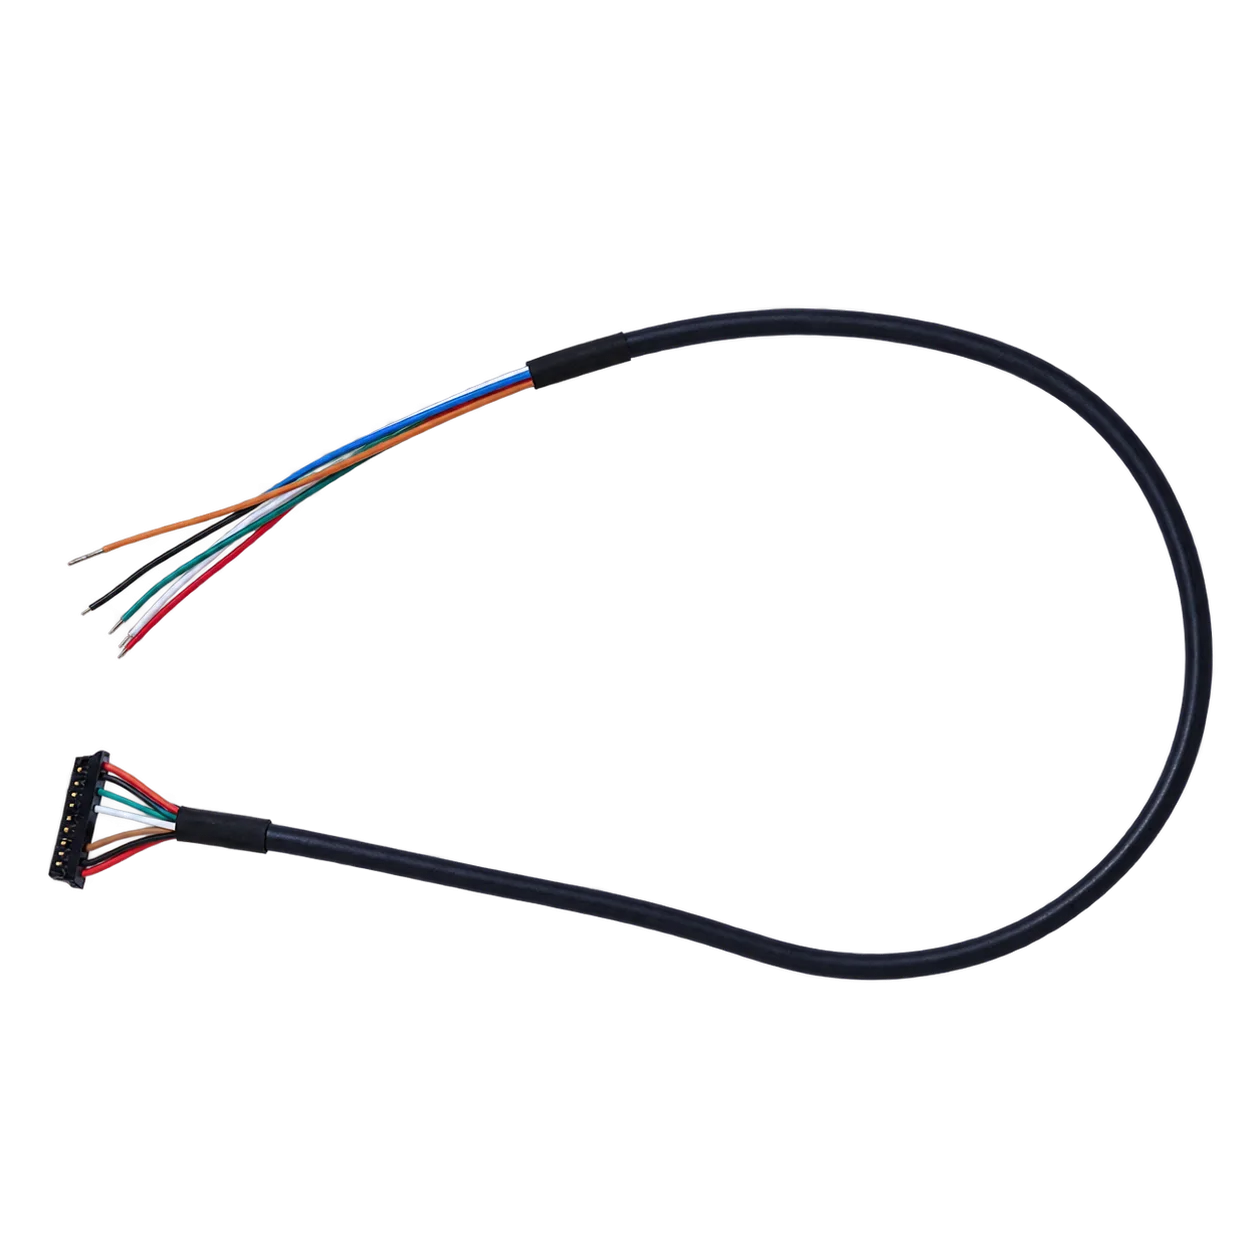
Request the AeroMini SDK and host resources for the exact board, firmware, output format and host. Validate capture, control, NUC behavior and any required temperature export on the sample. Availability of an archive does not prove that it has been tested on your operating system or that all video paths work simultaneously.
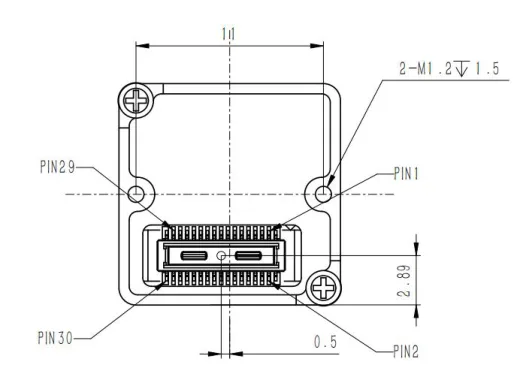
For SuperMini, use the 30-pin core definition. UART uses 1.8 V logic, and TX/RX are named from the core’s perspective. The imaging 640 and thermographic 640T have different output semantics; 640T’s CDS3/MIPI temperature data need the documented parser and conversion for the selected mode. Confirm receiver timing with the matched firmware. BT656 and MIPI cannot operate at the same time.
5.3 Enclosure and Payload Validation
For an inspection enclosure or camera payload, qualify the assembled product against the intended installation and the supplier’s documented limits. The component specification does not by itself certify the finished equipment or establish uninterrupted 24/7 operation.
- ⚙️ Installed mass and mounting: Check total mass, center of mass, mounting stiffness, cable strain relief, connector access and heat path with the selected lens and board.
- ⚙️ Vibration and shock: Set acceptance conditions for the installation and validate any isolation with the actual assembly. A core mass alone does not establish suitability for a particular mount.
- ⚙️ Environmental window: Use an optical window suitable for LWIR and account for transmission, thermal and calibration effects in the completed enclosure.
6. Migration Strategy: Moving from Mobile Prototypes to OEM Production
6.1 Carry the Mobile Prototype’s Requirements into the OEM Design
A mobile camera such as the thermal master p3 can be a useful inspection prototype. Migration becomes necessary when the intended product needs a different optical arrangement, host interface, package, data workflow or support commitment. Document what already works before choosing a replacement.
- ⚙️ Software baseline: Record app or host version, capture format, settings and test results. Re-test after changes; do not assume an update will either break or preserve a workflow.
- ⚙️ Mechanical baseline: Preserve working distance, field of view, focus requirements, clearance and cable routing when comparing a new assembly.
- ⚙️ Supply and support: Request lead time, change-notification practices, lifecycle information and production configuration control for either a mobile or OEM choice. Obtain written commitments instead of assuming guarantees from the product category.
For a detailed breakdown on upgrading legacy test systems to modular cores, review our engineering memo on LWIR thermal camera OEM retrofits. If you are developing gimbaled aerial pods, explore our dedicated line of industrial drone thermal cameras, or browse the broader CAMCUDA product catalog for application-specific configurations.
6.2 RFQ & Optical Specification Checklist
Before firing off an engineering RFQ for OEM thermal modules, specify these critical system parameters up front to save weeks of back-and-forth:
- ⚙️ Target Resolution & FOV: State object size, working distance, required detail, field of view and focus range. Compare detector resolution and the complete lens assembly; do not infer native pixels from enhanced output.
- ⚙️ Frame Rate / Refresh: State required capture rate, latency, timestamps and acceptable calibration interruptions. Select the imaging or radiometric version before setting the rate.
- ⚙️ Host Interface Architecture: Name the host, receiver, cable constraints and required output format. Request the exact board guide, driver or SDK and a sample capture.
- ⚙️ Serial Command Bus: Confirm control protocol, electrical levels, connector orientation and required commands for the selected board or core.
- ⚙️ Power Envelope Available: State regulated rails, startup allowance, noise budget and complete-system power target. Review the board-specific input and bare-core sequencing before wiring.
- ⚙️ Operating Conditions & Documentation: State ambient range, duty cycle, measurement accuracy needs, mounting limits and required documentation. Request the configuration-specific mechanical drawing and any procurement evidence separately.
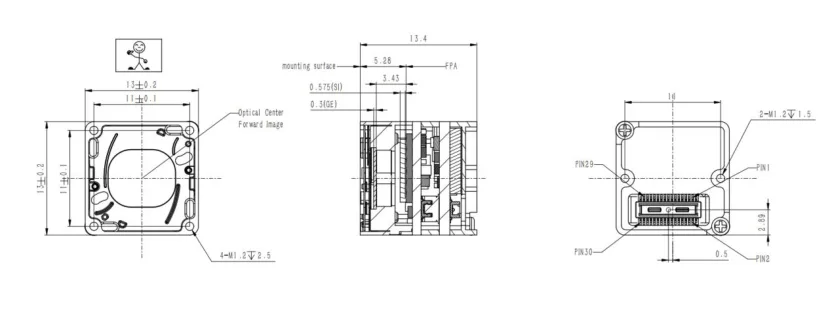
For a SuperMini bare-core layout, the drawing below supplies the published core reference only. The lens, flange, expansion board and cable clearance change the complete envelope. Request the drawing for the exact assembly before enclosure tooling. For AeroMini, likewise request a lens- and board-matched assembly drawing; its electrical pinout is not a mechanical CAD drawing.
7. Industrial Engineering FAQ
What should I check if a Thermal Master P3 image shows ghosting or a residual pattern?
Thermal Master states that its cameras perform automatic shutter calibration and also allow a manual app-triggered correction. First check focus, scene motion, processing settings and saved captures under repeatable conditions; then follow the model instructions for calibration and compare before and after. A persistent pattern needs the original file, configuration and manufacturer review. Neither a particular physical cause nor a guaranteed cure is established merely by calling the artifact “ghosting.” See the official calibration FAQ.
How does the Thermal Master P3 compare to dedicated OEM thermal cores for embedded systems?
The current P3 PCB Master is a 256 × 192 native mobile/PC-assisted camera with enhanced 512 × 384 output and a published 25 Hz rate. AeroMini and SuperMini are native 640 × 512 integration options with configuration-specific optics, boards and host requirements. AeroMini imaging is 60/30 Hz and its enquiry-only radiometric version is 25 Hz; SuperMini 640 imaging is 50 Hz and 640T thermography is 30 Hz. Choose according to required data and assembly constraints, then validate latency, software access and operating conditions rather than assuming every OEM core is radiometric or deterministic.
Can the Thermal Master P3 support precise manual temperature span and continuous data logging?
The current P3 listing advertises measurement, alarm, isotherm and report tools. The reviewed official sources do not establish exact numeric span persistence or unattended per-frame logging for every camera/app version. Confirm the controls and export workflow in the exact P3 version and companion software. A fixed display span, temperature measurement range, threshold alarm, saved video and a timestamped radiometric log are different functions. Test span behavior across scene changes and restart, and whether the chosen setup preserves measurement data for the full intended run. Check numeric per-frame export, timestamps, calibration metadata, correction events, storage limits and interruption recovery. Do not infer missing span controls or logging failures from the fact that it uses a phone. For an OEM alternative, specify those same acceptance tests and confirm that the selected radiometric variant and host software provide the required data.
What are the primary power supply considerations when integrating an OEM thermal core instead of a USB dongle?
Budget the complete system and follow the exact board or core requirements. The P3 lists 0.32 W for the camera, excluding host consumption. AeroMini lists typical module power below 0.5 W at 25°C; the illustrated POWER_IN1 and POWER_IN2 pins are 5 V and must not receive 12 V. SuperMini lists typical core power at or below 0.5 W at 25°C, excluding its expansion board. Its bare core requires MAIN_POWER at 3.8–5.2 V, typically 5 V, plus the specified 3.3 V and 1.8 V rails and power sequence. Add host and accessories, then measure startup and steady-state behavior.
📚 References & Further Reading
Product references checked 6 October 2026. Match the delivered camera, board and firmware to the applicable documents; published specifications are not results of a comparative bench test.
- P3 specifications: Thermal Master P3 PCB Master current product page
- P3 operation: Thermal Master official FAQ, official user-guide gateway, linked P-series manual and compatibility checker
- AeroMini configuration: AeroMini 640 product page, datasheet and SDK and Linux-resource FAQ
- SuperMini configuration: SuperMini 640 / 640T product page and English Product Manual V1.0.0
- Related Guide: LWIR Thermal Camera OEM Retrofit Engineering Memo
- Related Guide: Industrial Drone Thermal Cameras & Optical Payloads
- Related Guide: CAMCUDA OEM Thermal Imaging Solutions Catalog